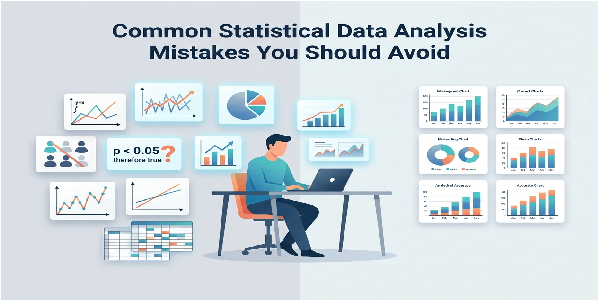
Common Statistical Data Analysis Mistakes You Should Avoid
Introduction: The Hidden Dangers in Numbers
In the era of data-driven decision-making, statistical analysis has become the compass for businesses and researchers. However, data does not speak the truth on its own; it is the analyst who must extract the hidden story using statistical tools. A flawed analysis can lead to disastrous financial decisions, wrong strategies, and invalid scientific results. In this article, we examine the most important and common mistakes in statistical analysis that every data analyst should avoid.
1. Confusing Correlation with Causation
One of the most famous statistical traps is assuming that if two variables move together, one must be the cause of the other. Correlation merely indicates the existence of a statistical relationship between two variables, while causation means one directly affects the other. For example, in summer, both ice cream sales and shark attacks on swimmers increase (positive correlation). But does eating ice cream cause shark attacks? No! The confounding variable here is the hot weather, which increases both ice cream consumption and the number of people in the sea.
2. Misunderstanding and Over-reliance on the P-value
In statistical hypothesis testing, researchers often look for $p < 0.05$ to declare their results “significant.” A common mistake is thinking the P-value represents the probability that the null hypothesis is true. In reality, the P-value indicates how likely it is to observe data this extreme (or more extreme) assuming the null hypothesis is true. Blind reliance on this number without considering the effect size and Type I error leads to misleading conclusions.
3. Ignoring Sampling Bias
Statistical analysis is based on samples to generalize results to a larger population. If the selected sample is not truly representative of the population, the analysis results are invalid. The sample size ($n$) is also crucial. Very small samples have high variance and their results are unreliable, while in very large samples, even trivial differences might be shown as statistically significant.
4. Model Overfitting
In predictive modeling, overfitting occurs when you build an overly complex model that memorizes noise and random fluctuations in the training data instead of learning the underlying patterns. Such a model performs stunningly well on current data but fails completely when faced with new, unseen data.
A Mathematical Look at a Common Mistake: Calculating Sample Variance
A very basic yet frequent mistake among beginners is the difference between calculating population variance and sample variance. The formula for population variance is as follows:
$$ \sigma^2 = \frac{\sum_{i=1}^{N} (x_i – \mu)^2}{N} $$
However, when we are working with a sample and want to estimate the population variance, if we use $n$ in the denominator, our estimate will be biased and will underestimate the true variance. To fix this, Bessel’s Correction is used, changing the denominator to $n – 1$:
$$ s^2 = \frac{\sum_{i=1}^{n} (x_i – \bar{x})^2}{n – 1} $$
In this formula, $s^2$ is the sample variance, $x_i$ represents the data points, $\bar{x}$ is the sample mean, and $n$ is the sample size. Forgetting this subtle difference can introduce calculation errors in more complex models.
Conclusion
Statistical analysis is a powerful tool, but like any sharp instrument, it requires careful and correct handling. Being aware of the difference between correlation and causation, truly understanding software outputs, selecting appropriate samples, and validating models will save you from falling into statistical traps. Always question your assumptions and let the data show you the way with complete transparency.