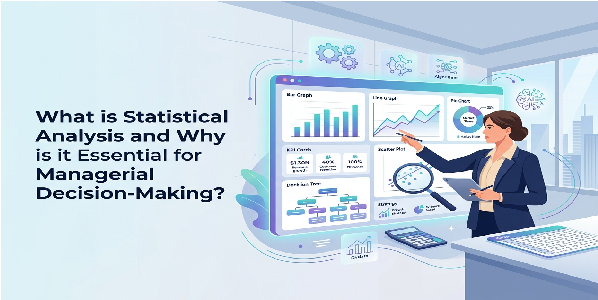
What is Statistical Analysis and Why is it Essential for Managerial Decision-Making?
Introduction: Moving from Intuition to Data-Driven
In today’s fast-paced and complex business world, relying on guesswork or merely personal experience to make macro-decisions carries a very high risk. Statistical Analysis is the science of collecting, exploring, and uncovering hidden patterns amidst a wealth of data. This process helps managers extract valuable and reliable information from raw, meaningless data, guiding their organization based on facts and with the least amount of error.
Types of Statistical Analysis in Management
To better understand the application of statistics in management, we must get acquainted with the four main levels of data analysis:
- Descriptive Analysis: What happened? This type of analysis describes the past situation using indicators like mean and standard deviation.
- Diagnostic Analysis: Why did this happen? In this stage, the causes of a phenomenon (e.g., a drop in sales) are investigated by examining correlations.
- Predictive Analysis: What will happen? Future trends are predicted using modeling and machine learning.
- Prescriptive Analysis: What should be done? This is the highest level of analysis that recommends the best possible action to the manager.
Why is Statistical Analysis Crucial for Managerial Decision Making?
Data-Driven Decision Making has countless benefits for organizations. Some of the most important reasons for the necessity of using statistical analysis include:
- Reducing Risk and Uncertainty: By more accurately predicting market demand and consumer behavior, the costs of wrong decisions are minimized.
- Optimal Resource Allocation: Identifying the most profitable segments of the organization helps financial managers invest the budget where it has the highest Return on Investment (ROI).
- Evaluating Actual Performance: With the help of Key Performance Indicators (KPIs) and variance analysis, managers can measure the deviation of actual performance from set goals.
A Key Concept: Linear Regression for Sales Forecasting
One of the most powerful statistical tools for managers is Linear Regression. Suppose you want to measure the impact of the advertising budget on the company’s sales. The simple linear regression formula is expressed as follows:
$$y = \beta_0 + \beta_1 x + \epsilon$$
In this formula:
Variable $y$ represents the dependent variable (e.g., sales volume).
Variable $x$ represents the independent variable (e.g., advertising budget).
The value $\beta_0$ represents the y-intercept (sales when advertising is zero).
The value $\beta_1$ is the slope of the line and shows how much variable $y$ changes for one unit increase in $x$.
The value $\epsilon$ is the random error of the model.
By calculating the values of $\beta_0$ and $\beta_1$, managers can accurately predict exactly how much sales will grow if they increase the advertising budget by 50% next month.
Steps for Implementing Statistical Analysis in the Organization
To leverage the power of data, organizations must go through a structured process:
- Defining the Problem: First, it must be determined exactly what question management is seeking to answer.
- Data Collection: Extracting relevant data from organizational databases (CRM, ERP, etc.).
- Data Cleaning: Removing incomplete, duplicate, and outlier data to prevent analytical errors.
- Execution of Analysis and Modeling: Using software such as SPSS, R, or Python to apply statistical tests.
- Interpretation and Visualization: Converting complex statistical outputs into charts and management dashboards (like Power BI) for final decision making.
Conclusion
Statistical analysis is no longer a competitive advantage, but a condition for the survival of businesses in modern markets. Managers who can understand the language of data and base their strategies on statistical models like trend forecasting and risk analysis will lead their organizations toward profitability and sustainable growth with greater confidence.
Frequently Asked Questions (FAQ)
1. Do managers need to be statistics experts to use statistical analysis?
No. Managers do not need to master complex formulas; rather, they need to be able to interpret analytical results and reports and apply the resulting insights to business strategies. Technical tasks are usually performed by data analysts.
2. What is the difference between descriptive and inferential statistics in management?
Descriptive statistics merely summarize existing data and display the current or past situation (like average monthly sales). However, inferential statistics use sampling to generalize the results to the entire population or the future (like predicting the behavior of millions of customers by surveying a thousand customers).
3. What are the best software tools for statistical analysis in business?
For basic analysis, Excel is widely used. For more advanced analysis, software like SPSS and Minitab are popular, and for big data analysis, programming languages like R and Python along with visualization tools like Tableau and Power BI are utilized.